This practical guide covers the key marketing metrics we track in dashboards for small business clients across web, social, email, and ads — based on years of running a marketing agency. This isn't for you if you don’t care about measuring your marketing results.
Introduction
Some business owners are serious about marketing. Others? Not so much. It never ceases to amaze me when I see an otherwise smart business leader who doesn’t want to be bothered with measuring marketing metrics. They either assume marketing and sales are the same thing (they’re not — see my post Stop Confusing Marketing with Sales, They’re Not the Same Thing), or they just care about one number: revenue.
As a business owner myself, I get it — revenue is important. But it’s not the only measure of success. When the bottom line looks good, some people stop asking questions. If it doesn’t, they just throw more money at ads, cross their fingers, and hope for the best.
If that sounds like you, feel free to move along — this article isn’t for you. But stick with me if you’re a business owner, marketer, or leader who cares about marketing performance and wants to know how to measure success.
I’ve been a professional marketer for over 25 years. Dashboards are, without a doubt, the most effective way to track marketing.
With so many things to track, marketing data can quickly become overwhelming. That’s why my agency, Country Fried Creative, uses marketing dashboards to organize everything in a clear, actionable way for our clients.
In this guide, I’ll break down the four key areas we track in marketing dashboards. We’ll walk through how to set up dashboards, provide real examples, and share essential tips and common mistakes to avoid. I’ve written extensively about analytics, the math behind running campaigns, and other technical aspects of marketing. This article is specifically about dashboards — what to track and how to use them effectively. Check out the resources listed at the end of the article for more information about marketing metrics and campaign strategy.
By the time you finish reading, you’ll have a practical framework for tracking your marketing like a pro. Because if you can’t measure it, you can’t manage it.
Why We Use Dashboards (And Why You Should Too)
Marketing success requires more than creative content (although that’s very important). Effective marketing requires tracking what works and what doesn’t. But with data scattered across multiple platforms — Google Analytics, Facebook Insights, email reports, ad dashboards — it’s easy to feel overwhelmed.
That’s where marketing dashboards come in.
A well-structured dashboard consolidates all your key performance metrics into a single, easy-to-use interface. Instead of wasting time pulling reports from different sources, you get real-time insights that help you make informed decisions faster and with more confidence.
At Country Fried Creative, we use DashThis to create marketing dashboards for our clients because it works well for most businesses with minimal configuration fuss. It’s powerful, easy to use, and integrates seamlessly with the major marketing platforms we rely on.
There are plenty of other dashboard tools out there — like Google Looker Studio (formerly Data Studio), Klipfolio, Databox, Tableau, AgencyAnalytics, Funnel.io, and SuperMetrics. Some of these, like Looker Studio and Tableau, offer more customization and power — but they also come with a steeper learning curve and more complicated setup. For many teams and organizations, ease of use and quick implementation matter more than advanced features they’ll never use.
After years of working with small businesses, we’ve found that the most critical marketing metrics fall into four main categories:
- Website Analytics — Tracks traffic, engagement, and conversions.
- Social Media Analytics — Measures reach, engagement, and audience growth.
- Email Marketing Analytics — Evaluates open rates, clicks, and list performance.
- Advertising Analytics — Monitors ad performance, cost, and return on investment (ROI).

These four categories provide key descriptive statistics. They show you what’s happening in your marketing, making it easier to spot issues and make informed adjustments. In this article, I’ll walk you through how we build dashboards for our clients, using our agency’s setup as an example.
Setting Up Your Marketing Dashboard
Before you can start using a dashboard effectively, you need to connect it to the right data sources. Without access to accurate and up-to-date data, your dashboard is useless. Here’s what you need to set up a fully functional marketing dashboard.
What You Need to Connect
You'll need to integrate data from various platforms to get a complete picture of your marketing performance. Here are the essentials:
- Google Analytics & Google Search Console — Tracks website traffic, user behavior, and search visibility.
- Social Media Accounts — Facebook, Instagram, LinkedIn, X (formerly Twitter), and YouTube analytics for engagement and audience growth.
- Email Marketing Platforms — Mailchimp, Constant Contact, HubSpot, or your chosen tool to track open rates, clicks, and subscriber activity.
- Advertising Accounts — Google Ads, Meta Business Manager, LinkedIn Ads, and other ad platforms to track spend, performance, and ROI.
Many dashboard tools offer direct integrations with these platforms, making it easier to access real-time data.
Be Prepared for Some Setup Frustrations
While dashboards can simplify marketing reporting, the setup process isn’t always smooth. Here are some common gotchas to watch out for:
- You need admin-level access — If you’re setting up a dashboard for a business, ensure you have the correct permissions for each platform. Many social media and ad accounts have different user roles, so double-check access levels before getting started.
- Two-factor authentication (2FA) can slow things down — Many platforms require 2FA for security, which means logging in to each account one at a time to authenticate access. It’s annoying, but it’s worth it. Once connected, you won’t have to deal with it daily.
- Data sync delays — Some dashboard tools refresh data instantly, while others update at set intervals (hourly, daily, or longer). Make sure you understand the refresh rate of your dashboard to avoid confusion when reviewing performance.
- API limitations — Some platforms limit the amount of data you can pull or require paid API access for advanced tracking. If you run into missing data, check the platform’s API restrictions.
- Historical data availability — Some platforms only pull recent data when you first connect them, so for year-over-year comparisons, you may need to manually upload past reports.
Getting It Right from the Start
A well-structured dashboard saves time and makes decision-making easier — but only if it’s set up correctly. Take the time to ensure all accounts are properly connected, double-check data accuracy, and configure the dashboard so it’s easy to read at a glance.
Once the setup is complete, the real power of dashboards begins: tracking and optimizing your marketing performance. To show how this works in practice, we’ll review my agency’s own dashboard as an example in this article. Before we do that, let’s walk through the four key areas every marketing dashboard should include.
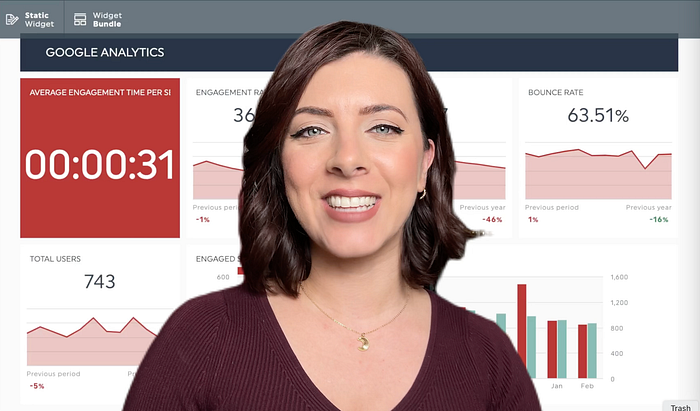
See One in Action: Dashboard Walk-Through
Want to see what all of this looks like in practice? Check out this quick video from Country Fried Creative’s Executive Vice President and Creative Director, Janine Baggett, as she walks through one of our marketing dashboards. She’ll show you how we organize client data, explain the different sections, and walk through the metrics you’ll see in the rest of this article.
Website Analytics: Understanding Your Traffic, Engagement, and Conversions
Your website is the foundation of your online presence. Whether potential customers find you through search engines, social media, or ads, their journey often starts with a visit to your site. Tracking website performance helps you understand how visitors engage with your content, where they come from, and what actions they take.
At Country Fried Creative, we track website performance using a combination of the following original data sources:
- Google Analytics — Tracks user behavior, traffic sources, and conversions.
- Google Search Console — Monitors search rankings, organic visibility, and keyword performance.
- Google Business Profile — Provides insights on local search performance, customer actions, and reviews.
Below, we’ll break down each of these key tools and what we track in our CFC dashboard.
Google Analytics: How Users Interact with Your Website
Key Metrics We Track:
- Total Users — The number of unique visitors.
- Sessions — The number of visits (a single user can have multiple sessions).
- Engagement Rate — The percentage of sessions where users actively interact with content.
- Bounce Rate — The percentage of visitors who leave after viewing only one page.
- Session Duration — The average time users spend on the site.
- Traffic Sources — Where visitors come from:
• Organic Search — Visitors who find you via search engines.
• Direct Traffic — Users who type in your URL or use a bookmark.
• Referral Traffic — Visitors from other websites linking to yours.
• Paid Search & Organic Social — Users coming from ads or social media.

📊 Google Analytics Breakdown:
- Engagement Rate (56.97%) shows strong visitor interaction, but there’s room to improve. Note: Engagement Rate + Bounce Rate = 100%.
- Sessions (983) indicate how often users visit, helping us track return traffic.
- Bounce Rate (43.03%) is a critical indicator — lower rates suggest people are exploring rather than leaving immediately. A high bounce rate used to be considered bad, but not necessarily anymore. With one-click and zero-click results, people may not spend as much time on your site, especially if they find what they’re looking for quickly.
- Traffic Sources tell us where visitors come from and help us fine-tune SEO, advertising, and social media strategies.
Google Search Console: How People Find You on Search Engines
Google Search Console reveals how well your website ranks in search results and what search terms drive traffic. Unlike Google Analytics, which tracks visitor behavior, Search Console focuses on search visibility and this category of analytics help you measure the effectiveness of your Search Engine Optimization (SEO) efforts. With the advent of AI-augmented zero-click search results like Google AI Overviews, things are likely to change in the future, so keep that in mind.
Key Search Metrics We Track:
- Total Impressions — How many times your website appears in search results.
- Total Clicks — The number of times users click on your search result.
- Click-Through Rate (CTR) — The percentage of users who click after seeing your page in search results.
- Average Position — Your average ranking for keywords in Google Search.
- Top Search Queries — Keywords that bring the most traffic.

📊 Google Search Breakdown:
- The low CTR (0.78%) suggests that we may need to optimize title tags and meta descriptions to improve click-through rates. However, remember the earlier comment about zero-click results. If someone finds what they’re looking for without clicking, that’s not necessarily bad.
- Average Position (58.0) tells us where our pages rank. A lower number is better, meaning our content appears higher in search results. Realistically, as a small local marketing agency it’s very unlikely that we’ll rise to the top of Google on topical searches. Keep that in mind if you’re a small, local business. Companies much larger than you are spending hundreds of thousands of dollars on SEO to rank highly.
- Top Queries show which keywords bring traffic. Understanding these helps us optimize content around what people are already searching for. As you can see from the information in the dashboard above, there’s quite a bit of interest in analytics and marketing ROI. Using information like that has shown us there’s quite a bit of interest in that — which is one reason I started this blog!
The data from Google Search Console helps us refine our SEO strategy, identify ranking opportunities, and improve organic visibility over time. Organic SEO is a long-term play, and it takes time to see changes. Search Engine Marketing (SEM) using paid search, like Google PPC (Pay-per-click), is more effective as a short-term ranking tactic. We’ll explore paid search later in this article.
Google Business Profile: Local Search & Customer Actions
For businesses that serve a local audience, Google Business Profile (GBP) is perhaps the most important thing to optimize and track. Tracking GBP will show you how users discover and engage with your business through Google Search and Maps. Having an updated, accurate, and well-structured GBP listing is the absolute best way to be found in Google Search if you’re a local business. GBP data feeds directly into Google’s Search database.
Key GBP Metrics We Track:
- Total Views — How many times your business profile appeared in searches.
- Customer Actions:
• Website Clicks — How many people visited your website.
• Phone Calls — Number of calls directly from the search listing.
• Direction Requests — How often users ask for directions to your business. - Top Google Services — How many views came from Google Search vs. Google Maps.
- Top Reviews — New customer feedback and ratings.

📊 Google Business Profile Breakdown:
- 261 Total Views means people are actively seeing our profile.
- Website Clicks, Phone Calls, and Direction Requests indicate real-world engagement from search traffic.
- Views on Search (154) vs. Views on Maps (107) help us understand how users are discovering the business.
Monitoring Google Business Profile ensures local SEO optimization. It allows us to track brand visibility, customer interactions, and review trends.
By combining Google Analytics, Google Search Console, and Google Business Profile, we get a full picture of website performance:
✔️ Google Analytics shows how visitors behave once they arrive.
✔️ Google Search Console tells us how they found us.
✔️ Google Business Profile reveals local search interactions.
This data-driven approach helps us improve SEO, engagement, and conversions — so we can make informed marketing decisions.
Next, let’s move to social media analytics, where we track how audiences engage with our content across Facebook, Instagram, and LinkedIn.
Social Media Analytics: Measuring Reach, Engagement, and Growth
Social media is a critical part of a marketing strategy, but not all platforms work the same way. Each social channel has its own strengths, target audience, and engagement patterns. That’s why tracking the right metrics for each one is important.
At Country Fried Creative, we use three primary social media channels and monitor social media analytics across each of them:
- Facebook — A broad audience with strong local business visibility.
- Instagram — A highly visual platform focused on engagement.
- LinkedIn — A professional networking site that drives B2B interactions.
Below, we’ll see how each platform works, who its audience is, and the key insights we track in our CFC social media dashboard.
Facebook: Increasing Brand Visibility with Organic & Paid Content
Facebook remains one of the most widely used platforms for small businesses, offering a mix of organic reach, community engagement, and advertising opportunities. While organic engagement has declined over the years, Facebook Ads and promoted posts allow businesses to increase reach efficiently.
Target Audience & Usage for Facebook
- Best for: Local businesses, community engagement, and paid advertising.
- Audience: A broad mix of demographics, with a stronger 35+ age group presence.
- Content That Works Best: News, updates, promotions, and community-driven posts.
- Biggest Strength: Advertising reach — even with declining organic engagement, Facebook Ads allow businesses to stay visible.
Key Metrics We Track on Facebook:
- Engaged Users — The number of people who interacted with posts.
- Page Impressions — The total number of times content was displayed.
- Page Engagement Rate — The percentage of people who engaged after seeing a post.
- Fan Count — The total number of followers on the business page.
- Top Performing Posts — Posts ranked by engagement rate, reactions, and shares. Hint: posts with pictures that have real people (customers, employees, etc.) taken at real locations do much better than AI-generated “slop” and computer-generated images!
In addition to showing the dashboard analytics from our Facebook page, we’re also going to compare two different months of Facebook data to illustrate the impact of Facebook advertising. This will highlight how paid promotions affect impressions, engagement, and overall visibility.

📊 December 2024 Facebook Stats (without Facebook Advertising):
- Impressions: 948 (this many people saw our posts)
- Engaged Users: 114 (this many people engaged with our posts with a like, share, or comment)
- Engagement Rate: 12.03% ( this is the number of engaged users divided by the number of impressions)

📊 February 2025 Facebook Stats (with Facebook Advertising):
- Impressions: 232,798 (📈 huge increase in visibility)
- Engaged Users: 386 (📈 more people interacting with posts)
- Engagement Rate: 0.17% (📉 lower, but expected with ad reach)
Facebook Takeaways:
- Ads increase impressions — more people see the content, improving brand awareness. In fact, because Facebook is so massive it’s hard to be successful marketing there without advertising.
- Engagement rates naturally decrease when reaching new audiences through ads because the number of impressions dilutes the engagement rate.
- A mix of organic & paid content ensures long-term engagement and visibility.
Instagram: Engaging Through Visual Content
Instagram is a platform built for visual storytelling, making it ideal for businesses that thrive on engaging photos, videos, and stories. While it operates differently from Facebook, both are owned by Meta, which provides shared advertising tools and insights. Unlike Facebook, Instagram still sees stronger organic engagement, allowing brands to connect more effectively with their audience through compelling visuals.
Target Audience & Usage for Instagram
- Best for: Brands with a strong visual presence, lifestyle businesses, and product-based companies.
- Audience: Younger demographic (18–34 years old), mobile-first users.
- Content That Works Best: High-quality images, reels, behind-the-scenes stories, and product showcases.
- Biggest Strength: Engagement rates — users are more likely to interact with content than on Facebook.
Key Metrics We Track on Instagram:
- Engagement Rate — The percentage of people interacting with posts.
- Impressions — The number of times posts appeared in user feeds.
- Follower Count — Measures audience growth over time.
- Likes & Comments — Shows how well content resonates with followers.
- Profile Views & Website Clicks — Indicates deeper interest in the brand.

📊 Instagram Performance (December 2024):
- Engagement Rate: 6.00% — This is a solid engagement rate, showing that users are actively interacting with content. While it’s slightly lower than previous periods, it still outperforms Facebook’s engagement rate.
- Impressions: 3,947 — A decent reach, indicating that posts are being seen regularly. To expand brand awareness, boosting posts or increasing posting frequency could help improve this number.
- Followers: 1,571 — A steady audience base with slow but consistent growth. This suggests that organic content is attracting new followers over time. We haven’t run any campaigns lately to encourage new Instagram followers, but if we did, then the follower number would grow significantly.
- Likes: 156 — A key indicator of content resonance. Posts are generating engagement, but experimenting with more interactive content (polls, reels, or carousels) could help boost this further. Starting this year (2025), we’ve started doing more short-form videos (reels) and so I expect our likes will go up significantly.
- Profile Views: 113 — This is an important metric because it shows that people are interested enough in the content to visit the profile. A strong call to action on posts could help convert these profile visitors into website clicks or followers. The classic “see link in bio” drives traffic to the profile. Don’t bother putting links in post captions. As of right now, they are not clickable (although that could change in the future)!
Comparing Facebook and Instagram Performance
- Instagram has a higher engagement rate (6.00%) compared to Facebook, meaning users on Instagram are more likely to interact with content rather than just scroll past it.
- Facebook impressions (232,798 in February) are significantly higher than Instagram’s (3,947 in December), largely due to the impact of Facebook advertising. However, Instagram’s smaller but more engaged audience suggests that content resonates more with users who see it.
- Facebook is better for increasing brand visibility and reach, especially when using paid promotions.
- Instagram is stronger for audience interaction, making it an effective platform for businesses that rely on visual storytelling and direct engagement with their followers.
Both platforms play different but complementary roles in a social media strategy — Facebook expands visibility, while Instagram fosters engagement. The best approach is to leverage both platforms strategically, using Facebook to reach a larger audience and Instagram to build deeper connections.
LinkedIn: Driving B2B Engagement & Professional Connections
LinkedIn is a professional networking platform, making it ideal for business-to-business (B2B) marketing, industry leadership, and recruiting. Unlike Facebook and Instagram, LinkedIn engagement is more intentional, meaning that people interacting with content are often decision-makers or industry peers.

Connect with me personally on LinkedIn or check out our company page.
Target Audience & Usage for LinkedIn
- Best for: B2B companies, professional services, and personal brand building.
- Audience: Business owners, executives, and professionals across industries.
- Content That Works Best: Thought leadership posts, case studies, company updates, and industry trends.
- Biggest Strength: Professional credibility — high engagement means quality interactions.
Key Metrics We Track for our company’s LinkedIn page:
- Engagement Rate — Percentage of people interacting with posts.
- Impressions — How often content appears in LinkedIn feeds.
- Clicks — Number of users clicking links in posts.
- Likes & Shares — Measures how well content resonates with professionals.
- Top Performing Posts — Shows which topics drive the most engagement.

📊 LinkedIn Performance (February 2025):
- Engagement Rate: 32.5% — This is the highest engagement rate 📈 of all the social platforms, indicating that LinkedIn users are highly engaged with the content.
- Impressions: 1,113 — While lower than Facebook and Instagram, LinkedIn impressions tend to be more valuable because they come from a highly targeted professional audience.
- Clicks: 272 — A strong indicator that LinkedIn posts are driving real interest and website traffic, outperforming 📈 Facebook and Instagram in direct actions.
- Likes: 83 — While lower than Instagram, the quality of engagement on LinkedIn tends to be more meaningful, often coming from industry peers and business decision-makers.
By analyzing Facebook, Instagram, and LinkedIn together, we get a full picture of how our social media presence performs:
✔️ Facebook — Broad reach, lower engagement with ads but strong brand visibility.
✔️ Instagram — High engagement, great for visual storytelling and audience interactions.
✔️ LinkedIn — Best platform for professional networking, engagement, and website traffic.
Each platform serves a different role, and understanding these insights helps optimize content strategy.
Next, we’ll explore email marketing analytics — how we track open rates, clicks, and conversions to measure campaign success.
Email Marketing Analytics: Tracking What Works in Your Campaigns
Email marketing remains one of the highest ROI marketing channels, but its effectiveness depends on audience engagement. Unlike social media, where engagement is passive, email requires an active decision — users must choose to open, read, and click.
At Country Fried Creative, we use Mailchimp to track email marketing performance, helping us measure who’s engaging, what content works best, and where we can improve.
Target Audience & Usage for Email Campaigns
- Best for: Direct audience communication, lead nurturing, and customer retention.
- Audience: Existing customers, subscribers, and potential leads.
- Content That Works Best: Personalized messages, newsletters, promotions, and exclusive offers.
- Biggest Strength: High ROI — email consistently outperforms most marketing channels in conversion rates. If you’re a nonprofit, email marketing is the number one way to increase donations because you can share an impact story and have a clickable link to capture a donation immediately.
Key Metrics We Track for our Email Campaigns:
- Unique Open Rate — The percentage of recipients who opened the email.
- Click-Through Rate (CTR) — The percentage of users who clicked a link inside the email.
- Top Campaigns — Identifies which email campaigns had the highest engagement.

📊 Email Performance (December 2024):
- Open Rate: 29.66% — A solid open rate, slightly above industry averages but down 19% from last year. This suggests we may need to test new subject lines or send times to improve performance.
- Click-Through Rate: 2.34% — While relatively low, it has increased 130% from the previous period, showing that content improvements or better call-to-actions may be working.
- Top Campaign: December 2024 Newsletter — Achieved the highest open rate of the recent campaigns.
- Note: We normally send a monthly company newsletter, which is our primary email campaign. Occasionally, we segment our audience into existing customers, leads, and other groups. Once segmented, we send specific emails targeted to each grouping. We’re still experimenting with email frequency and target audience. Because we’re a small business, we have a list size in the thousands, not hundreds of thousands, to work with, so we tend to focus on quality rather than quantity.
Email marketing provides direct, measurable engagement with an audience, making it one of the best tools for nurturing customer relationships. Unlike social media, where users passively scroll, email requires an active decision to open and engage — which is why tracking open rates and click-through rates is so important.
Next, we’ll examine advertising analytics, which measures the performance of paid campaigns to ensure that “pay-to-play” marketing dollars are spent effectively.
Advertising Analytics: Monitoring Ad Spend, Clicks, and ROI
Organic marketing — SEO, social media, and email — is essential, but if you want fast results, nothing beats advertising. Whether it’s Google PPC ads to boost search visibility or social media ads to expand reach, paid campaigns immediately put your brand in front of the right audience while supporting long-term marketing efforts.
There are plenty of places to advertise — traditional broadcast, online streaming, and even print magazines. But outside of online streaming, most of these are hard to track, especially print advertising, where measuring actual impact can feel like a guessing game. That’s why we prefer digital advertising — it allows us to fine-tune targeting, optimize performance, and measure results with precision.
That’s not to say other forms of advertising don’t work. Every business is different, and finding the right mix takes experimentation. But for us, Google PPC and Facebook Ads consistently deliver — so that’s where we focus our efforts.
At Country Fried Creative, we track two major types of digital advertising that drive results for our business:
- Facebook & Social Media Ads — Used to expand audience reach, boost engagement, and generate brand awareness.
- Google PPC (Pay-Per-Click) Ads — Designed to improve search engine visibility and capture high-intent traffic from people actively searching for services.
By closely monitoring impressions, clicks, conversions, and ad spend, we make sure every advertising dollar works as hard as possible.
Target Audience & Usage for Facebook Ads
- Best for: Increasing brand awareness, audience growth, and engagement.
- Audience: Custom audiences, retargeting visitors, and interest-based targeting.
- Content That Works Best: Promoted posts, carousel ads, and video ads.
- Biggest Strength: Cost-effective reach — Facebook Ads allow businesses to reach thousands of people for a fraction of the cost of traditional media.
Key Metrics We Track in Facebook Ads:
- Amount Spent — Total advertising budget used.
- Impressions — The total number of times the ad was displayed.
- Reach — The number of unique people who saw the ad.
- Clicks — Total number of interactions (link clicks, reactions, shares).
- Click-Through Rate (CTR) — Percentage of users who clicked after seeing the ad.
- Page Engagement — How many people engaged with the ad content.

📊 Facebook Ads Performance (February 2025):
- Amount Spent: $307.95 — Investment in paid advertising.
- Impressions: 248,271 — High visibility, showing how many times the ads were displayed.
- Reach: 152,413 — The number of unique users who saw the ads.
- Clicks: 186 — More interactions mean the ads are resonating with the audience.
- Page Engagement: 7,715 — A huge increase in engagement, demonstrating strong interest.
Target Audience & Usage for Google PPC Ads
- Best for: Driving website traffic, lead generation, and conversions.
- Audience: People actively searching for specific services or products.
- Content That Works Best: Search ads, display ads, and retargeting campaigns.
- Biggest Strength: High-intent traffic — people clicking on Google Ads are actively looking for a solution, making them more likely to convert.
Key Metrics We Track in Google PPC Ads:
- Cost-Per-Click (CPC) — How much each ad click costs.
- Click-Through Rate (CTR) — The percentage of users who clicked after seeing the ad.
- Impressions — How often the ad appeared in search results.
- Clicks — The number of times users clicked on the ad.
- Conversions — How many users took a desired action (purchases, sign-ups, or calls).
- Phone Calls — Tracks inbound calls generated from ads.

📊 Google PPC Ads Performance (February 2025):
- Average CPC: $1.93 — How much each click costs on average.
- CTR (Click-Through Rate): 4.36% — A strong indicator that ads are relevant to searchers.
- Impressions: 3,278 — A lower number than Facebook, but more targeted to high-intent users. High-intent users are people actively searching for a specific product or service, meaning they’re much closer to making a purchase or taking action compared to someone casually scrolling on social media.
- Clicks: 143 — A solid number of interactions, showing people are engaging with the ads.
- Conversions: 2 — A small but valuable number representing users who took action after clicking the ad. We probably need to work on conversions.
- Phone Calls: 6 — Direct inquiries generated from the ad campaign.
Advertising works best when paired with data-driven insights. By tracking key metrics across Facebook Ads and Google PPC, we can:
✔️ Use Facebook Ads for brand visibility and broad audience reach.
✔️ Leverage Google PPC for high-intent searches and direct conversions.
✔️ Optimize campaigns in real-time to maximize ROI.
There’s no one-size-fits-all approach to advertising, but combining social media and search ads allows us to reach customers at different stages of their journey — whether they’re just discovering the brand or actively looking for a solution.
With a well-structured advertising dashboard, we can fine-tune every campaign, ensuring that every dollar spent is delivering measurable results.
Conclusion: Track What Matters, Improve What Works
If you’ve made it this far, you’re serious about measuring marketing performance — and that puts you ahead of a lot of business owners who still think sales revenue is the only metric that matters.
We’ve covered the four key areas every marketing dashboard should include:
✔️ Website Analytics — Understand where traffic comes from and how visitors engage.
✔️ Social Media Analytics — Measure reach, engagement, and audience growth.
✔️ Email Marketing Analytics — Track open rates, clicks, and campaign performance.
✔️ Advertising Analytics — Monitor impressions, ad spend, and conversion rates.
Marketing without measurement is just guesswork. A well-built dashboard turns raw data into actionable insights — helping you spot trends, identify problems, and fine-tune your strategy.
Next Steps: What You Can Do Right Now
- If you don’t have a dashboard yet, start simple. Choose one metric per category (website, social, email, ads) and begin tracking it. You don’t need a fancy setup to get started.
- If you already use dashboards, refine them. Identify your weakest area — low engagement? High bounce rate? Poor email click-through? — and focus on improving it.
- Schedule time to review your data. A dashboard is only useful if you use it. Set a weekly or monthly habit of analyzing your numbers and making data-driven marketing decisions.
- And if you’re not sure where to begin, just start with what you know. Even a basic spreadsheet can become a dashboard if it gets you thinking about your numbers.
If you’re serious about marketing, tracking your results isn’t optional—it’s essential. Set up your dashboard, measure what matters, and begin making smarter decisions. If you can’t measure it, you can’t manage it.
Resources
Domaleski, J. (2025, January 19). The mathematics of running a small business marketing campaign: A practical guide. Marketing Data Science. Retrieved from https://blog.marketingdatascience.ai/the-mathematics-of-running-a-small-business-marketing-campaign-a-practical-guide-ba2f2f280baa
Domaleski, J. (2025, February 9). Digital Marketing Analytics for Nonprofit Leaders: Turning Data into Donors. Marketing Data Science. https://blog.marketingdatascience.ai/digital-marketing-analytics-for-nonprofit-leaders-turning-data-into-donors-b4b17eefe45e
Domaleski, J. (2024, September 2). How to build, manage, and measure a sales funnel. Marketing Data Science AI. https://blog.marketingdatascience.ai/how-to-build-manage-and-measure-a-sales-funnel-51dab683f426
Domaleski, J. (2024, September 8). A better marketing manifesto. Marketing Data Science. Retrieved from https://blog.marketingdatascience.ai/a-better-marketing-manifesto-24b6541a6cb9
Domaleski, J. (2024, November 11). Essential marketing analytics for small businesses: A guide to what really matters. Marketing Data Science. Retrieved from https://blog.marketingdatascience.ai/essential-marketing-analytics-for-small-businesses-a-guide-to-what-really-matters-68ed6f5e26a6
Domaleski, Joe. (2024, November 18). Stop Confusing Marketing with Sales — They’re Not the Same Thing. Marketing Data Science. Retrieved from https://blog.marketingdatascience.ai/stop-confusing-marketing-with-sales-theyre-not-the-same-thing-1ad4e9466c1f.
Domaleski, J. (2024, November 24). How we forecasted website traffic for a local newspaper using Meta’s Prophet and R. Marketing Data Science. Retrieved from https://blog.marketingdatascience.ai/how-we-forecasted-website-traffic-for-a-local-newspaper-using-metas-prophet-and-r-0ca046bfcb34
Domaleski, J. (2024, December 29). Using analytics to review year-end marketing performance and prepare for the new year. Marketing Data Science. Retrieved from https://blog.marketingdatascience.ai/using-analytics-to-review-year-end-marketing-performance-and-prepare-for-the-new-year-6e4217d19400